The Crucial Role of Quantitative Interpretation in Well Logging
Quantitative interpretation methods in well logging are pivotal for accurately analyzing and predicting subsurface conditions, reservoir characteristics, and fluid content. These methods use numerical data to assess various properties of the rock and fluid, aiding in the decision-making process for exploration and production.
Understanding Well Logging
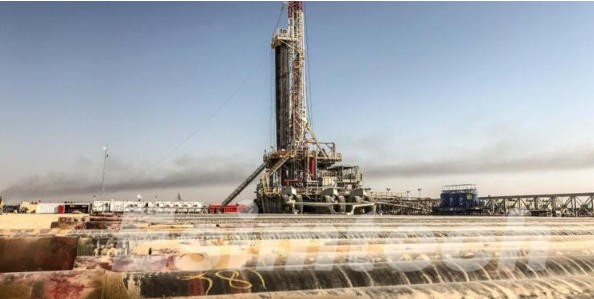
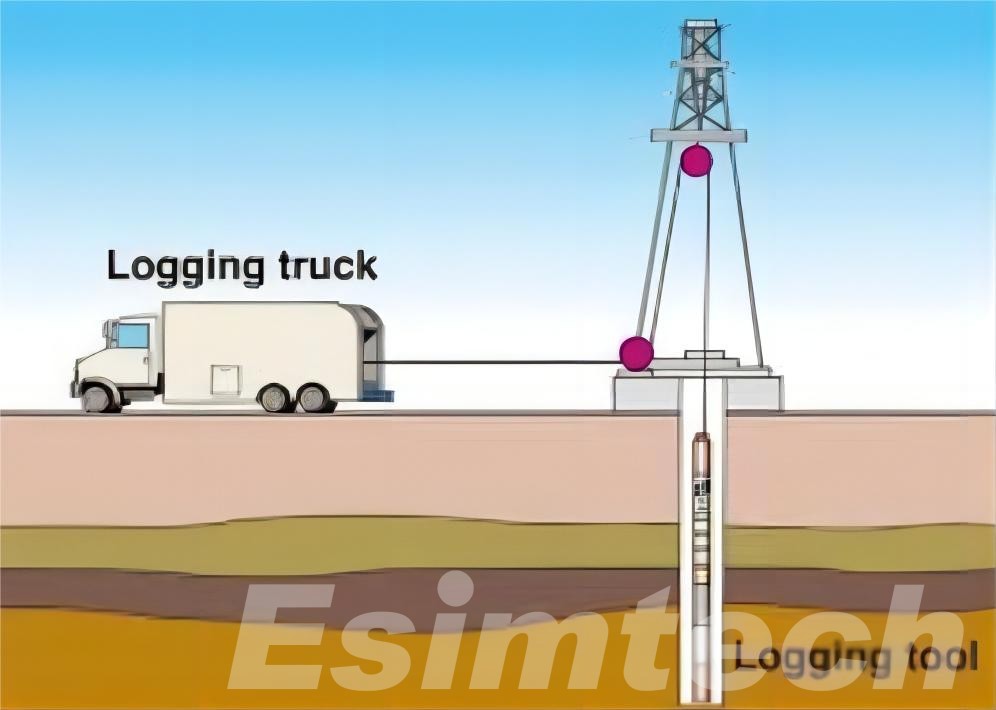
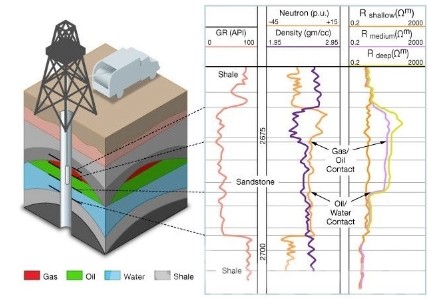
Well logging is a critical process in the oil and gas industry, providing essential data about the geological formations encountered during drilling. Well logging involves measuring the physical properties of subsurface formations using instruments and sensors deployed in a wellbore. The data collected provides insights into the formation's lithology, porosity, permeability, fluid saturation, and other key parameters. Quantitative interpretation methods process and analyze this data to offer a detailed understanding of the subsurface environment.
Key Quantitative Interpretation Methods Used in Well Logging
1. Resistivity Logging
Resistivity logging measures the electrical resistance of the formation, which helps in identifying the presence of hydrocarbons and assessing fluid content.
- Method: Tools like the later log, induction, and micro resistivity measure how the formation resists electrical current. High resistivity typically indicates hydrocarbon-bearing zones, while low resistivity may suggest water saturation or the presence of clays.
- Quantitative Analysis: Resistivity values are used to calculate hydrocarbon saturation using models such as Archie's equation, which relates resistivity to porosity and water saturation.
2. Density Logging
Density logging provides information about the bulk density of the formation, which is critical for evaluating porosity.
- Method: A gamma-ray source emits radiation that interacts with the formation, and the amount of radiation detected is inversely related to the formation’s density.
- Quantitative Analysis: Density logs help determine the formation’s porosity by comparing measured density with the density of the rock matrix and the density of fluids. Porosity is calculated using the bulk density and matrix density.
3. Neutron Logging
Neutron logging measures the hydrogen content in the formation, which is useful for assessing porosity and fluid saturation.
- Method: A neutron source emits neutrons that interact with hydrogen atoms in the formation. The detected neutron flux decreases with increased hydrogen content.
- Quantitative Analysis: Neutron logs are used to estimate porosity, particularly in formations with high water content. The results are often cross-referenced with density logs to obtain more accurate porosity measurements.
4. Sonic Logging
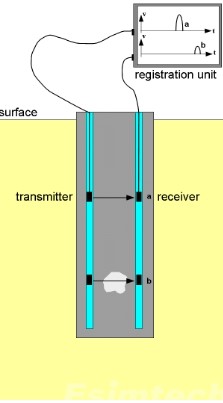
Sonic logging measures the travel time of acoustic waves through the formation, providing insights into rock properties and porosity.
- Method: Acoustic waves are generated and received by sensors in the wellbore. The velocity of these waves is influenced by the rock's elasticity and density.
- Quantitative Analysis: Sonic logs provide data on compressional and shear wave velocities. These velocities are used to calculate formation porosity, and mechanical properties, and to infer rock strength.
5. Gamma-Ray Logging
Gamma-ray logging measures natural gamma radiation emitted by the formation, which helps in identifying rock types and clay content.
- Method: A gamma-ray detector measures the intensity of radiation from the formation. High gamma-ray readings typically indicate shale or clay-rich formations.
- Quantitative Analysis: Gamma-ray logs are used to calculate the volume of shale in the formation, which helps in interpreting lithology and assessing the cleanliness of the reservoir rock.
6. Crossplot Analysis
Crossplot analysis involves plotting different well-log measurements against each other to interpret formation properties.
- Method: Various logs, such as resistivity vs. porosity or density vs. neutron porosity, are plotted to identify patterns and relationships.
- Quantitative Analysis: Crossplots help differentiate between hydrocarbon-bearing zones and water-bearing zones, as well as identify lithological variations and fluid content.
7. Formation Evaluation Models
Formation evaluation models integrate data from multiple logs to provide a comprehensive analysis of the formation.
- Method: Models such as Archie’s model for resistivity and Timur’s model for porosity use data from resistivity, density, neutron, and sonic logs to evaluate formation properties.
- Quantitative Analysis: These models provide estimates of hydrocarbon saturation, formation porosity, permeability, and other critical reservoir parameters.
Challenges and Future Trends in Quantitative Interpretation for Well Logging
| Category | Challenges | Future Trends |
| Data Accuracy | 1. Ensuring accuracy and consistency of data from various logging tools. | 1. Advanced calibration techniques and error correction algorithms to improve data reliability. |
| Complex Formation Characteristics | 2. Interpreting data in formations with complex lithology or high clay content. | 2. Development of advanced models and techniques for complex formations, including multi-spectral imaging. |
| Integration of Multi-Tool Data | 3. Integrating data from different logging tools requires careful calibration and alignment. | 3. Enhanced data fusion methods and integration platforms for seamless data combination. |
| High-Speed Data Processing | 4. Processing large volumes of data from high-speed logging operations. | 4. Real-time data processing capabilities with improved computational power and algorithms. |
| Interpretation of Anomalous Data | 5. Challenges in interpreting anomalous or unexpected data points. | 5. AI and ML models for automated anomaly detection and interpretation. |
| Data Management and Storage | 6. Managing and storing vast amounts of well-log data efficiently. | 6. Cloud-based solutions for scalable data storage and advanced analytics. |
| Model Validation and Calibration | 7. Continuous validation and calibration of quantitative models with actual well data. | 7. Improved validation techniques and adaptive models for real-world accuracy. |
| Machine Learning and AI | 8. Integration and application of ML and AI in quantitative interpretation. | 8. Enhanced AI algorithms and machine learning techniques for better pattern recognition and prediction. |
| Real-Time Data Processing | 9. Delays in data processing affecting timely decision-making. | 9. Implementation of real-time data analytics and automated feedback systems. |
| Cloud-Based Solutions | 10. Transitioning to cloud-based data management and analysis. | 10. Leveraging cloud computing for advanced analytics, collaboration, and scalability. |
| Enhanced Visualization | 11. Limited advanced visualization tools and user interfaces. | 11. Development of advanced visualization tools and user-friendly interfaces for better data interaction. |
| Cross-Disciplinary Integration | 12. Integrating quantitative interpretation with other disciplines like geology and geophysics. | 12. Holistic approaches combining insights from multiple disciplines for comprehensive formation analysis. |
How Simulations are Used for Quantitative Interpretation in Well Logging
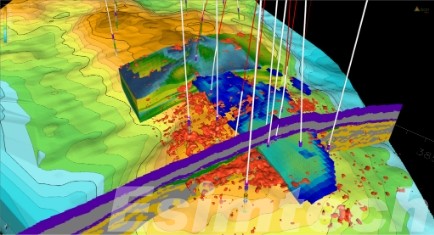
1. Reservoir Modeling and Simulation
Purpose
- Reservoir Modeling: To predict fluid flow, reservoir behavior, and production performance under various conditions.
- Quantitative Interpretation: This helps in understanding the reservoir characteristics and predicting how different formations will affect logging data.
Method
- Numerical Simulations: Utilize finite difference or finite element methods to solve equations governing fluid dynamics, rock mechanics, and heat transfer.
- Input Data: Includes petrophysical properties (porosity, permeability), fluid characteristics, and geological data.
Applications
- Forecasting Production: Estimating future production rates and reservoir performance.
- Optimization: Enhancing drilling and completion strategies based on simulated reservoir behavior.
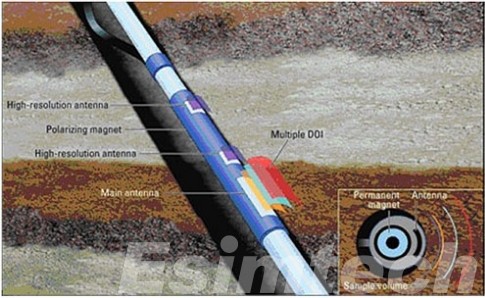
2. Logging Tool Simulation
Purpose
- Tool Response Simulation: To simulate how different well logging tools interact with subsurface formations.
- Quantitative Interpretation: Helps in designing and calibrating logging tools, and understanding how tool measurements correlate with formation properties.
Method
- Simulation Models: Create virtual environments to replicate the operation of logging tools and their interactions with different rock and fluid types.
- Tool Characteristics: Includes parameters such as tool geometry, calibration factors, and measurement principles.
Applications
- Tool Design: Optimizing tool designs and configurations.
- Data Calibration: Ensuring accurate calibration of logging tools to improve data quality.

3. Synthetic Log Generation
Purpose
- Synthetic Logs: To generate simulated well log data based on predefined geological and petrophysical models.
- Quantitative Interpretation: Provides a basis for training algorithms, validating data, and understanding tool responses.
Method
- Petrophysical Models: Apply mathematical models to create synthetic log responses for various formation types.
- Data Comparison: Compare synthetic logs with real log data to validate interpretation models and tools.
Applications
- Algorithm Training: Developing and testing interpretation algorithms.
- Data Validation: Ensuring the accuracy and reliability of real well log data.
4. Data Integration and Analysis
Purpose
- Integrated Models: To combine data from different simulations and real-world logs for comprehensive analysis.
- Quantitative Interpretation: Enhances the accuracy of formation evaluation by integrating multiple data sources.
Method
- Data Fusion: Merging data from various oil and gas simulations, including reservoir models, logging tool responses, and synthetic logs.
- Analytical Techniques: Utilizing statistical and machine learning techniques to analyze integrated data sets.
Applications
- Formation Characterization: Providing a more detailed understanding of subsurface formations.
- Decision Support: Supporting better decision-making by combining diverse data sources.

5. Real-Time Simulation and Monitoring
Purpose
- Real-Time Analysis: To simulate and analyze data in real-time during logging operations.
- Quantitative Interpretation: Allows for immediate feedback and adjustments based on current well conditions.
Method
- Real-Time Simulations: Implementing advanced computational techniques to process and interpret data as it is collected.
- Monitoring Systems: Using real-time data feeds and simulations to monitor well conditions and tool performance.
Applications
- Operational Efficiency: Facilitating timely adjustments to drilling and logging operations.
- Anomaly Detection: Identifying and addressing issues as they arise during logging.
In summary, techniques such as resistivity, density, neutron, sonic, and gamma-ray logging provide essential data for assessing formation properties and fluid content. Through integrating data from multiple logs and leveraging advanced technologies, the accuracy and effectiveness of well logging are continually improving, addressing challenges and enhancing reservoir management strategies. Simulations are a vital tool in quantitative interpretation for well logging, offering a virtual environment to model reservoir behavior, tool responses, and data analysis processes.